ACTIVE REGIONS / SPOTS
— / —
Loading the Earth-facing region report
NOAA SWPC
LIVE OBSERVATORY / HELIOPHYSICS
The Sun is not quiet. Magnetic fields twist, active regions flare, and immense clouds of plasma sometimes cross the space between us.
01 / THE SUN NOW
UPDATING…
ACTIVE REGIONS / SPOTS
— / —
Loading the Earth-facing region report
NOAA SWPC
SOLAR WIND SPEED
— km/s
Loading upstream measurements
NOAA SWPC · L1
IMF Bz · GSM
— nT
Loading the north–south magnetic field
NOAA SWPC · L1
SOLAR-WIND DENSITY
— p/cm³
Loading upstream plasma density
NOAA SWPC · L1
PLANETARY Kp ESTIMATE
—
Loading geomagnetic conditions
NOAA SWPC
GOES X-RAY FLUX
—
Loading flare intensity
NOAA SWPC · GOES
≥10 MeV PROTONS
— pfu
Loading radiation measurement
NOAA SWPC · GOES
CMEs · LAST 7 DAYS
—
Loading NASA event analysis
NASA DONKI
These measurements describe different parts of the Sun–Earth system. A high sunspot number does not by itself mean a storm is coming. Earth effects depend on an eruption's direction, speed, magnetic orientation, and the conditions it meets in space.
02 / OUTLOOK
Observations say what is happening now. Forecasts describe what NOAA expects and must always be read as forecasts—not guarantees.
Receiving the latest SWPC forecast discussion…OPEN OFFICIAL FORECAST + RATIONALE ↗
OVATION 30–90 MINUTE OUTLOOK
NOAA’s operational aurora forecast uses the solar wind and magnetic field measured upstream at L1. Darkness, weather, and a clear horizon still matter where you are.
VIEW THE LIVE AURORA FORECAST ↗ MODEL OUTPUT · NOT A GUARANTEE OF VISIBILITY03 / SEE THE SUN
These are the latest available near-real-time NASA SDO browse images. They update roughly every fifteen minutes; each channel reveals a different solar layer.
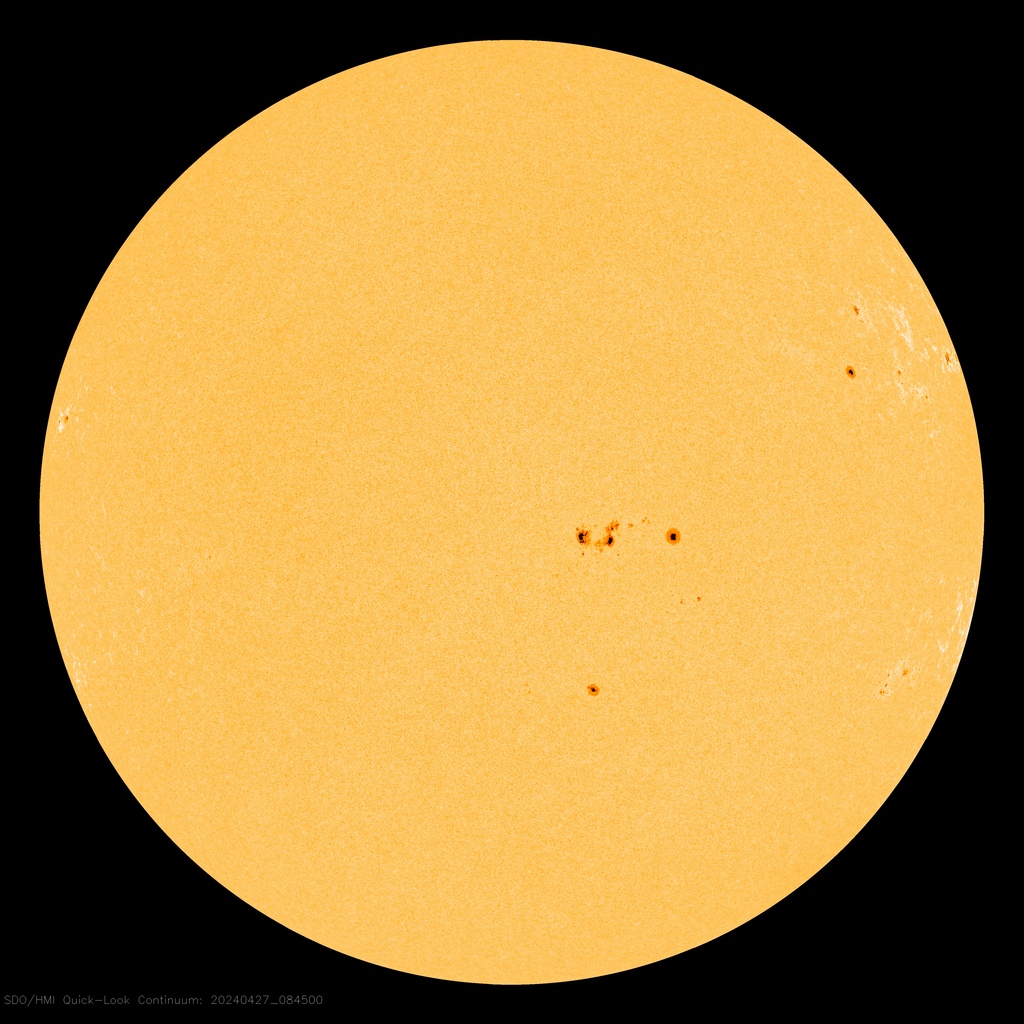 HMI CONTINUUM · SUNSPOTS
Courtesy of NASA/SDO and the AIA, EVE, and HMI science teams. Browse imagery is for context and education; the NOAA values above are the page’s operational measurements.
OPEN NASA SDO DATA ↗04 / ACTIVE REGIONS
Positions, spot counts, magnetic classes, and flare probabilities come from NOAA’s latest solar-region report. Select any row or marker.
05 / ACTIVITY LOG
NASA records observed coronal mass ejections, then adds modeled properties as analysis becomes available.
06 / FIELD GUIDE
A darker, cooler-looking patch in the visible photosphere where concentrated magnetic fields suppress convection. Active regions around sunspots can produce flares and CMEs.
MAGNETIC REGIONA rapid release of electromagnetic radiation from the solar atmosphere. Its light and X-rays reach Earth in about eight minutes and can disrupt radio communication.
RADIATION · MINUTESA large eruption of magnetized plasma from the corona. If aimed toward Earth, the disturbance commonly takes roughly one to three days to arrive.
PLASMA · DAYSA disturbance of Earth's magnetic environment caused by sustained coupling with the solar wind. It can intensify aurora and affect satellites, navigation, radio, and power systems.
EARTH RESPONSE07 / WHY IT MATTERS
Space weather is beautiful, but it is also operational science. Forecasts help spacecraft operators, aviators, radio users, navigators, and electric-grid managers prepare for changing conditions.
Storm-driven particles brighten the upper atmosphere and can push aurora toward lower latitudes.
Ionospheric changes can degrade high-frequency radio and satellite-navigation accuracy.
Radiation and atmospheric expansion can affect electronics, sensors, orientation, and orbital drag.
Rapid magnetic changes can induce currents in long conductors, including transmission networks.